
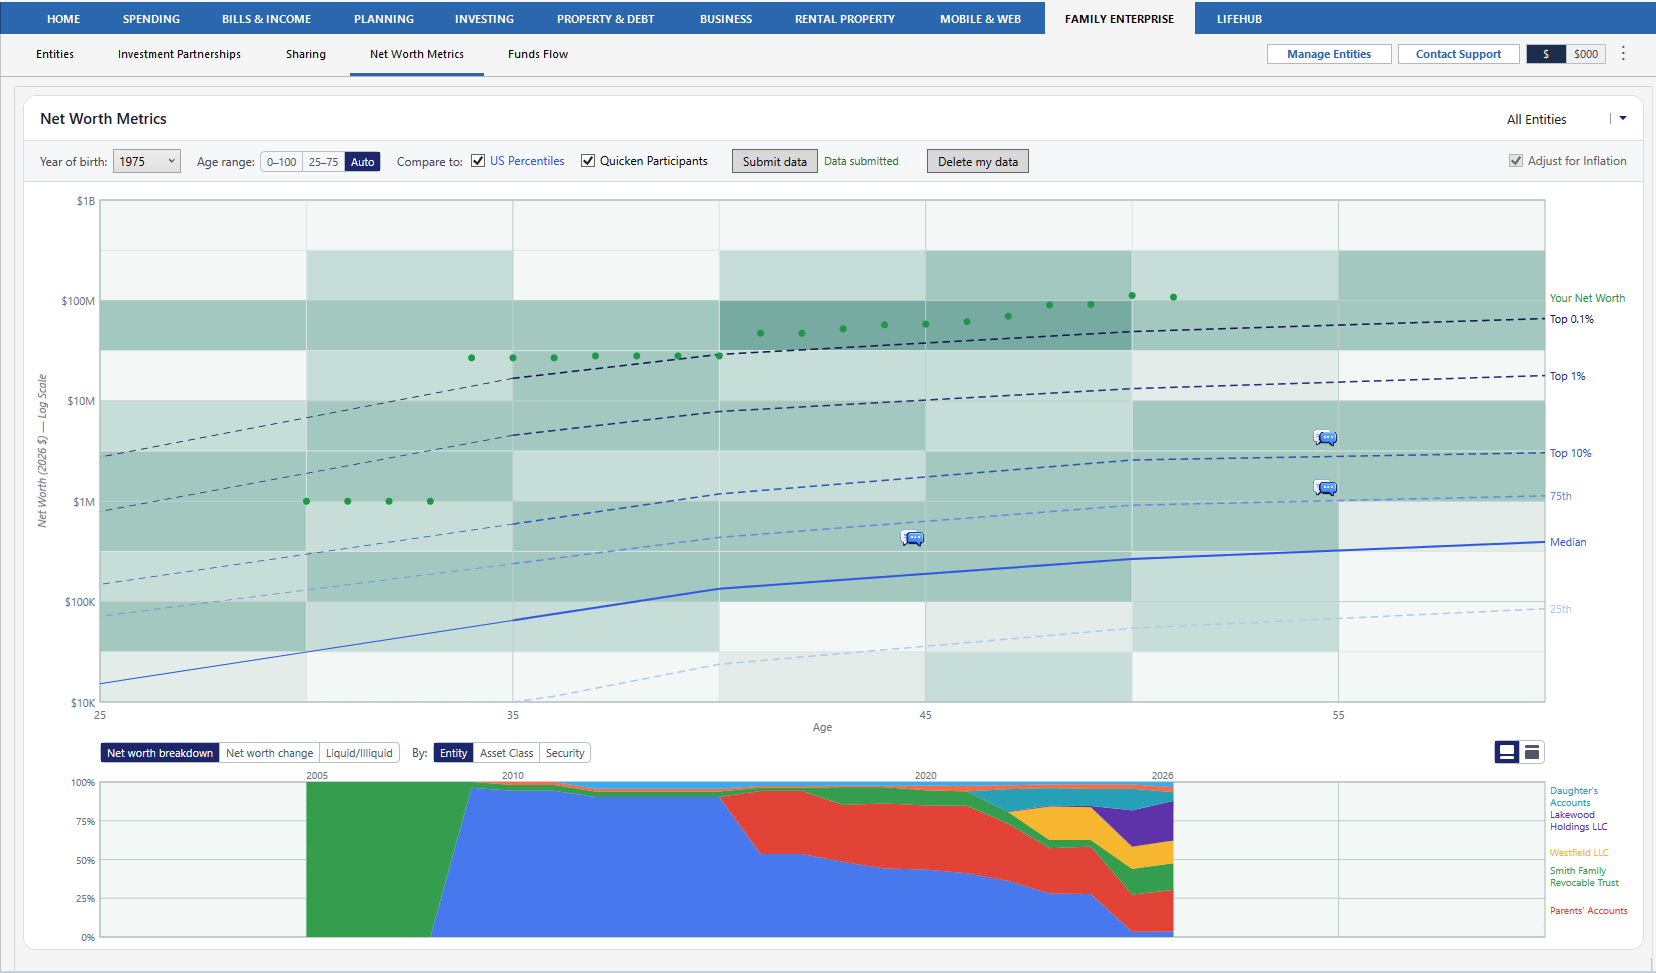
The Net Worth Metrics subtab in Quicken Family Enterprise puts your net worth in context. It shows how your net worth compares with US benchmarks and other Quicken users, how it’s divided among your entities and holdings, how it has changed over time, and how much of it you can convert to cash quickly. To open it, select the Family Enterprise tab, and then select Net Worth Metrics.
Filter and arrange the subtab
The entity selector at the top right of the subtab controls which data appears in all four charts. Select All Entities, a single entity, or an entity group.
Two other controls apply throughout the subtab:
-
Use the view buttons at the top right of the report area to divide space between the comparison chart and the report below it. One view enlarges the comparison chart, and the other enlarges the report.
-
Hover over any data point in any chart to see more detail.
Compare your net worth with benchmarks
The comparison chart at the top of the subtab plots your net worth by age. You can compare it with US net worth percentiles, with anonymized data from Quicken Participants, or with both.
Set up the chart
Use the controls above the chart to set up the comparison:
-
Year of birth: Select your birth year so Quicken can plot your net worth by age.
-
Age range: Select 0 to 100 or 25 to 75 for a fixed range, or select Auto to have Quicken set the range.
-
Compare to: Select US Percentiles, Quicken Participants, or both.
-
Adjust for Inflation: Select this checkbox to show all amounts in current-year dollars.
Read the chart
The vertical axis uses a logarithmic scale, so each gridline marks a tenfold increase in net worth. A short distance near the top of the chart represents a much larger dollar difference than the same distance near the bottom.
The chart uses these elements:
-
Green dots show your net worth at each age. Quicken plots them from your data file whether or not you share your data.
-
The solid line shows median net worth for the comparison group.
-
Dashed lines show percentile markers for the 25th percentile, the 75th percentile, the top 10 percent, the top 1 percent, and the top 0.1 percent.
-
Shaded cells appear when Quicken Participants is selected. Darker shading means more participants fall in that age and net worth range. Your own submitted data isn’t counted in the shading.
-
Message icons mark cells where other participants have left soundbites, which are short comments about their finances. Hover over an icon to read them.
Share your data with Quicken Participants
Quicken Participants is a pool of anonymized net worth data that Quicken users choose to share. Sharing is optional, and your own data points appear on the chart either way.
To add your data to the pool:
-
Select Submit data.
-
Enter your year of birth, your ZIP code, and a short soundbite about your finances.
-
Confirm that your data is accurate, and then submit it.
After you submit, Data submitted appears next to the button. To remove your data from the pool, select Delete my data. You can delete your data at any time.
See what makes up your net worth
The Net worth breakdown view in the report area shows how your net worth is divided over time. Each colored band represents one part of your net worth, and the height of the band shows that part’s share of the total at each point in time. The legend at the right matches each color to its entity, asset class, or security.
Use the By buttons to group the chart by Entity, Asset Class, or Security. Hover over the chart to see the exact breakdown at any point in time.
Track changes in your net worth
The Net worth change view shows how much your net worth changed in each period, rather than its running total. Each bar shows the change for one period, divided into segments such as money added, balance adjustments, investment income, or individual securities and entities, depending on how you group the chart. The total column at the right sums the change across the full time range.
Use the By buttons to group the chart by Entity, Asset Class, Security, or Category/Security Income. When you select Category/Security Income, two checkboxes appear: Security Income and Non-Security Income. Clear either checkbox to leave that type of income out of the chart.
Hover over a bar or segment to see its amount for that period.
See how much of your net worth is liquid
The Liquid/Illiquid view sorts your net worth by how quickly and cheaply you can convert it to cash. Quicken assigns your holdings to two categories by default, and you can add two more:
-
Liquid: Checking and savings accounts, cash in brokerage accounts, and quoted securities in any account, including retirement accounts. Quoted securities are stocks, exchange-traded funds (ETFs), mutual funds, and bonds with a public market price. Quicken treats quoted securities in retirement accounts as liquid because you can sell them quickly, even when selling them has tax consequences.
-
Illiquid: Asset, liability, and loan accounts, such as real estate and mortgages, and securities without a public market price, such as private equity and venture holdings. Capital already called into a partnership also counts as illiquid.
-
Tax-deferred: Retirement account holdings, such as IRA and 401(k) balances, shown separately from liquid holdings. This category is off by default.
-
Special situations: Up to five securities you choose to show individually. This category is empty by default.
Show tax-deferred holdings separately
Turn on the tax-deferred breakout to move retirement account holdings out of the liquid category and into their own band. Your totals don’t change. The chart shows the same money in a separate band, so you can see how much of your liquid net worth sits in tax-deferred accounts.
Show specific securities individually
Use special situations to call out holdings you consider costly to sell, such as securities with a large unrealized gain. Each security you select moves out of its usual category and appears in its own color.
To select securities:
-
In the Liquid/Illiquid view, select Break out selected securities.
-
Select Select, and then choose up to five securities.