
The Family Enterprise tab brings together cross-entity views of net worth, income, investments, asset allocation, and investment partnerships in one place. You can see your financial picture across multiple entities without switching between separate areas of Quicken.
The tab is organized into two subtabs: Entities and Investment Partnerships.
Tab-level controls
Three controls sit at the top right of the tab, across from the subtab headers.
Contact Support opens the Family Enterprise Support dialog, which provides contact information for the Executive Care Team. From the dialog, you can also open the Quicken website to view team hours and schedule a callback. Callback appointments are available seven days a week, including weekends.
Amounts in Thousands is on by default and displays large dollar values in thousands, rounded to the nearest thousand. For example, $100,000,795 displays as $100,001. This is useful when values exceed available column width.
The ⋮ (three-dot menu) provides these options:
|
Option |
Description |
|---|---|
|
Track Overall Entity Selection |
When enabled (indicated by a checkmark), all cards in the Family Enterprise tab respond to the entity selector in the title bar. Individual cards keep their own entity selectors and can be adjusted independently, but they realign whenever the title-bar selection changes. When disabled, cards do not respond to the title-bar selector. |
|
Family Enterprise Overview |
Opens a dialog that provides an overview of Family Enterprise capabilities and links to step-by-step guidance on product overview, entities, focused views, entity-level reporting, entity sharing, investment partnerships, bill pay, online backup, and the Executive Care Team. |
|
Manage Entities |
Opens the Manage Entities window, where you can create and delete entities and entity groups, assign or unassign accounts, and configure entity-specific settings. For details, see Managing Entities and Accounts. |
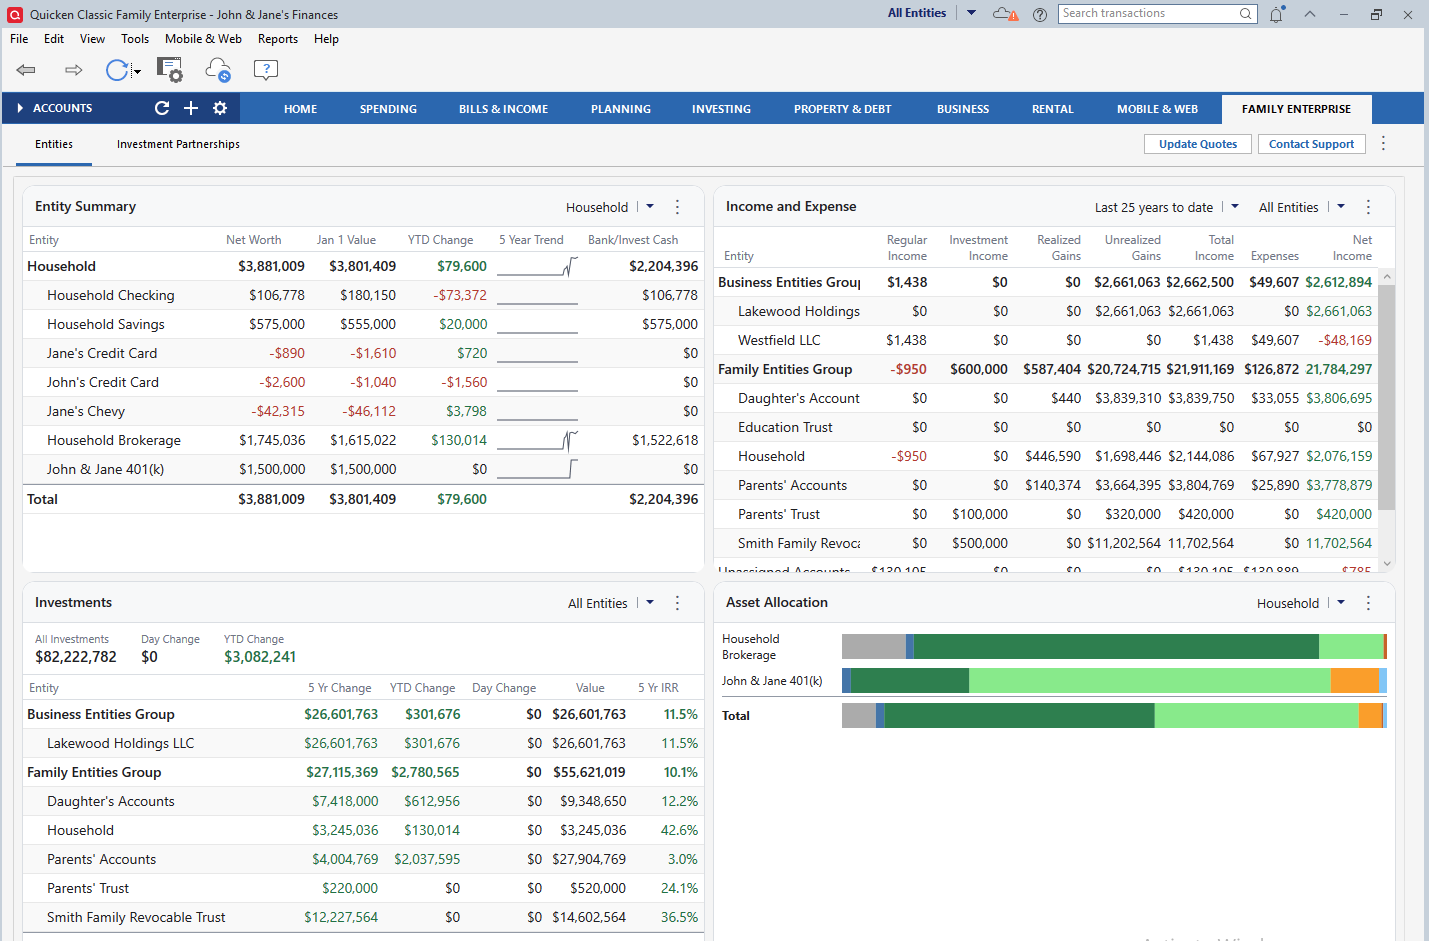
Entities subtab
The Entities subtab gives you a cross-entity view of your financial life through four cards: Entity Summary, Income and Expense, Investments, and Asset Allocation.
Each card has its own entity selector in the top right corner, with the same options as the title-bar selector: your entity groups, individual entities, and Unassigned (accounts not assigned to any entity). The selection scopes the data shown in that card. A three-dot menu sits to the right of each entity selector and provides card-specific options.
How card layouts adapt to the entity selector
The Entity Summary, Income and Expense, and Investments cards share the same hierarchical layout, which adapts based on the entity selector:
|
Selector |
Layout |
|---|---|
|
All Entities |
Entity groups appear as bolded rows. The entities in each group appear beneath their group with names indented. The group row reflects the aggregate of its entities. A Total row at the bottom represents the aggregate across everything displayed. |
|
A specific entity |
The entity name appears as a bolded row at the top. The accounts in that entity appear beneath it with names indented. The entity row reflects the aggregate of its accounts. A Total row at the bottom represents the combined total across all accounts. |
The Asset Allocation card uses a different layout, described in that card's section below.
Entity Summary card
The Entity Summary card shows a hierarchical summary of your financial position.
Columns:
|
Column |
Description |
|---|---|
|
Net Worth |
Current net worth. |
|
Jan 1 Value |
Net worth as of January 1 of the current year. |
|
YTD Change |
Change in net worth from January 1 to today. |
|
5 Year Trend |
A sparkline showing net worth movement over the past five years. |
|
Bank/Invest Cash |
Combined cash balance across bank and investment accounts. |
Three-dot menu options:
|
Option |
Description |
|---|---|
|
Show 5-Year Trend |
Toggles the 5 Year Trend column on or off. |
|
Entity Overview Report |
Opens the Entity Overview report. |
|
Funds Flow Overview Report |
Opens the Funds Flow Overview report. |
|
Cash-Equivalent Securities |
Opens a dialog where you define which securities count as cash equivalents for the Bank/Invest Cash column. |
Income and Expense card
The Income and Expense card shows income, gains, expenses, and net income broken down by entity and entity group.
Date range selector. A date range selector to the left of the entity selector defines the time period the data reflects. Options: Year to Date, Last 12 months, Last year, Last 3 years to date, Last 5 years to date, Last 10 years to date, Last 25 years to date.
Columns:
|
Column |
Description |
|---|---|
|
Regular Income |
Non-investment income for the period. |
|
Investment Income |
Income generated from investment accounts. |
|
Realized Gains |
Gains from securities that have been sold. |
|
Unrealized Gains |
Gains on securities still held. You can toggle this column from the three-dot menu. |
|
Total Income |
Sum of regular income, investment income, realized gains, and unrealized gains. |
|
Expenses |
Total expenses for the period. |
|
Net Income |
Net result across income, gains, and expenses. |
Three-dot menu options:
|
Option |
Description |
|---|---|
|
Include Unrealized Gains |
Toggles the Unrealized Gains column on or off. |
|
Entity Overview Report |
Opens the Entity Overview report. |
Investments card
The Investments card shows investment performance across entities and entity groups. Three summary figures appear at the top of the card:
|
Figure |
Description |
|---|---|
|
All Investments |
Total current value of all investment holdings across the selected scope. |
|
Day Change |
Change in total investment value from the previous trading day. |
|
YTD Change |
Change in total investment value since January 1. |
The table below the summary breaks these figures down by entity.
Columns:
|
Column |
Description |
|---|---|
|
5 Yr Change |
Change in investment value over the past five years. |
|
YTD Change |
Change in investment value since January 1. |
|
Day Change |
Change in investment value from the previous trading day. |
|
Value |
Current total investment value. |
|
5 Yr IRR |
Internal Rate of Return over the past five years. |
Three-dot menu options:
|
Option |
Description |
|---|---|
|
Investment Performance Report |
Opens the Entity Investment Performance report. |
Update Quotes refreshes the latest market values for your publicly traded investment holdings.
Asset Allocation card
The Asset Allocation card shows asset allocation as horizontal stacked bar charts. Each row represents an entity or account, and the Total bar at the bottom represents the combined allocation across the current selection.
Unlike the other cards, entity groups do not appear as their own rows when All Entities is selected. Individual entities are listed directly. The behavior adapts based on the entity selector:
|
Selector |
Layout |
|---|---|
|
All Entities |
Each entity appears as its own bar. The Total bar represents the combined allocation across all entities. |
|
Entity group |
The entities in that group appear as individual bars. The Total bar represents the combined allocation for the group. |
|
Specific entity |
The accounts in that entity appear as individual bars. The Total bar represents the combined allocation for the entity. |
Asset classes are color-coded and identified in a legend at the bottom of the card: Unclassified, Domestic Bonds, Large Cap Stocks, Small Cap Stocks, International Stocks, Other, Cash, and Alternative.
Hover over any bar segment to see a tooltip that identifies the asset class and the percentage it represents within that entity or account's allocation.
Three-dot menu options:
|
Option |
Description |
|---|---|
|
Asset Allocation Report |
Opens the Asset Allocation report. |
|
Show Entity Group Allocations |
Toggles entity group rows on or off within the card. |
Investment Partnerships subtab
The Investment Partnerships subtab is where you track and manage private investment partnerships. It brings together committed capital, capital call history, distributions, valuations, and performance metrics for each partnership.
From this subtab, you can track a partnership's full lifecycle: set up a new partnership, record capital calls and distributions, log and update valuations, and close a partnership when it has run its course. All activity is logged to an account register of your choosing, which keeps your partnership data integrated with the rest of your Quicken file.
The subtab contains three cards: Partnership Summary, Capital Calls, and Distributions.
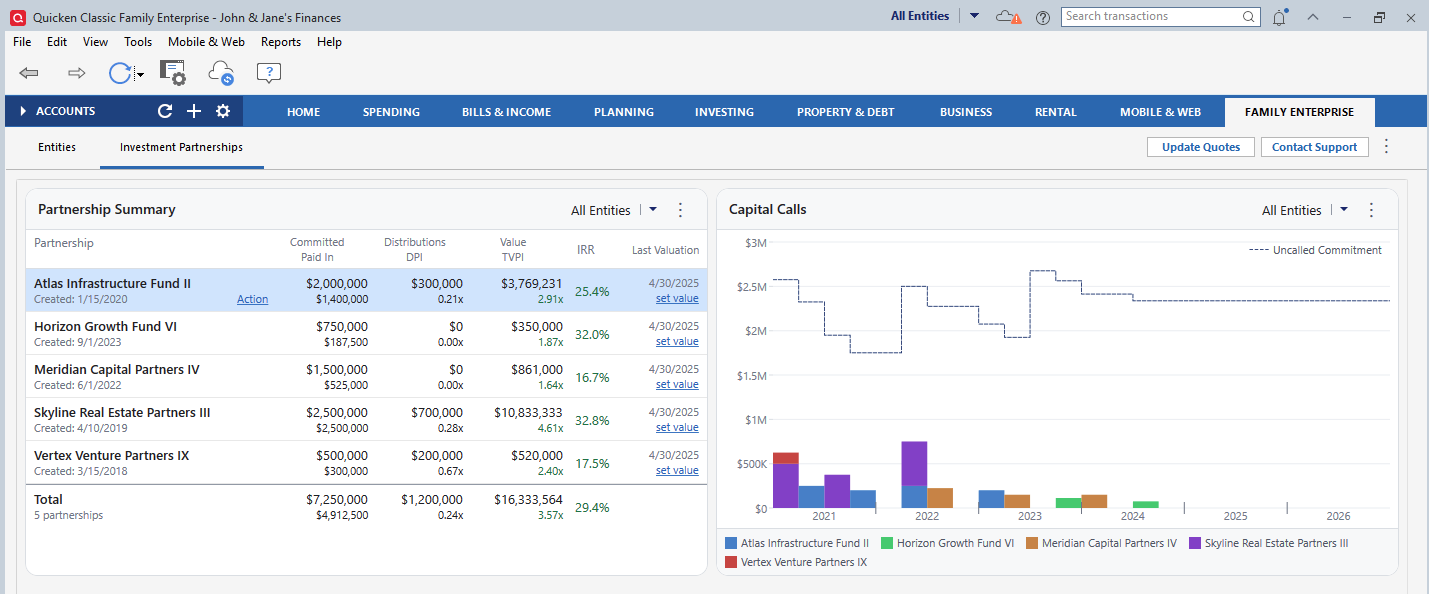
Partnership Summary card
The Partnership Summary card displays a row for each investment partnership you track, with aggregate totals at the bottom. Each row shows the partnership name, creation date, and an Action link that opens partnership-specific actions.
Columns. Three of the columns display two values stacked within the same row: the top value reflects the column's first label, and the bottom value reflects the column's second label.
|
Column |
Description |
|---|---|
|
Committed / Paid In |
Total capital committed to the partnership (top); total capital called and paid in to date (bottom). |
|
Distributions / DPI |
Total cash distributions received (top); Distributions to Paid-In multiple (bottom). |
|
Value / TVPI |
Current estimated value (top); Total Value to Paid-In multiple (bottom). |
|
IRR |
Internal Rate of Return since inception. |
|
Last Valuation |
Date of the most recent valuation. Shows a Set Value link when a new valuation can be entered. |
The Total row reflects aggregate figures across all partnerships and includes the total partnership count.
Action link options. Each partnership row's Action link provides:
|
Option |
Description |
|---|---|
|
Close Partnership |
Marks the partnership as closed. |
|
Edit Partnership |
Opens the partnership details for editing. |
|
Move Investment Partnership Transactions |
Moves all activity logged for this partnership to another account register of your choosing. |
|
Capital Call |
Records a new capital call. |
|
Distribution |
Records a new distribution. |
When you first record activity for a partnership, such as a capital call, you are prompted to select the account register where the partnership's transactions will be logged. If you need a new account for this purpose, create one from Add Account for Investment Partnerships in the card's three-dot menu.
Three-dot menu options:
|
Option |
Description |
|---|---|
|
Investment Partnership Report |
Opens the Investment Partnership report. |
|
Show Closed Partnerships |
Toggles visibility of closed partnerships in the card. |
|
Add Account for Investment Partnerships |
Adds a new account to log investment partnership activity. |
|
Set Up Partnership |
Walks you through creating a new partnership. |
|
Import |
Imports partnership data from a file. |
|
Create Sample Import Files |
Generates a sample import file you can use as a formatting reference. |
Capital Calls card
The Capital Calls card displays capital call activity as a grouped bar chart. Each bar segment represents an individual partnership's capital calls within a given year. Partnerships are color-coded and identified in a legend at the bottom of the card.
A dotted line runs across the chart representing your total committed but uncalled capital, the amount you have pledged to your partnerships that has not yet been drawn. As capital calls are made over time, this line steps down accordingly. This gives you an at-a-glance view of how much liquidity you should have available for future calls.
Three-dot menu options:
|
Option |
Description |
|---|---|
|
Investment Partnership Report |
Opens the Investment Partnership report. |
|
Show Closed Partnerships |
Toggles visibility of closed partnerships in the chart. |
Distributions card
The Distributions card shows quarterly cash distributions received from your private investment partnerships, broken out by fund and stacked for easy comparison. A dashed line tracks your cumulative life-to-date distributions over time, giving you a combined view of recent activity and long-term return history in a single chart.
Use the entity selector to focus on distributions within a specific part of your financial picture. Use the time range selector to toggle between 5-year, 10-year, and 25-year views.
Sharing subtab
The Sharing subtab is where you manage access to your entities for other people. You can invite someone to view or edit specific entities, set permission levels, track invitation statuses, and remove access when needed. For full details, see About Entity Sharing.
For more information