
The Funds Flow subtab on the Family Enterprise tab shows how money moved through your finances over a date range you choose. It shows where money came from, how it moved between your entities and entity groups, and where it went.
To open Funds Flow, go to Family Enterprise > Funds Flow.
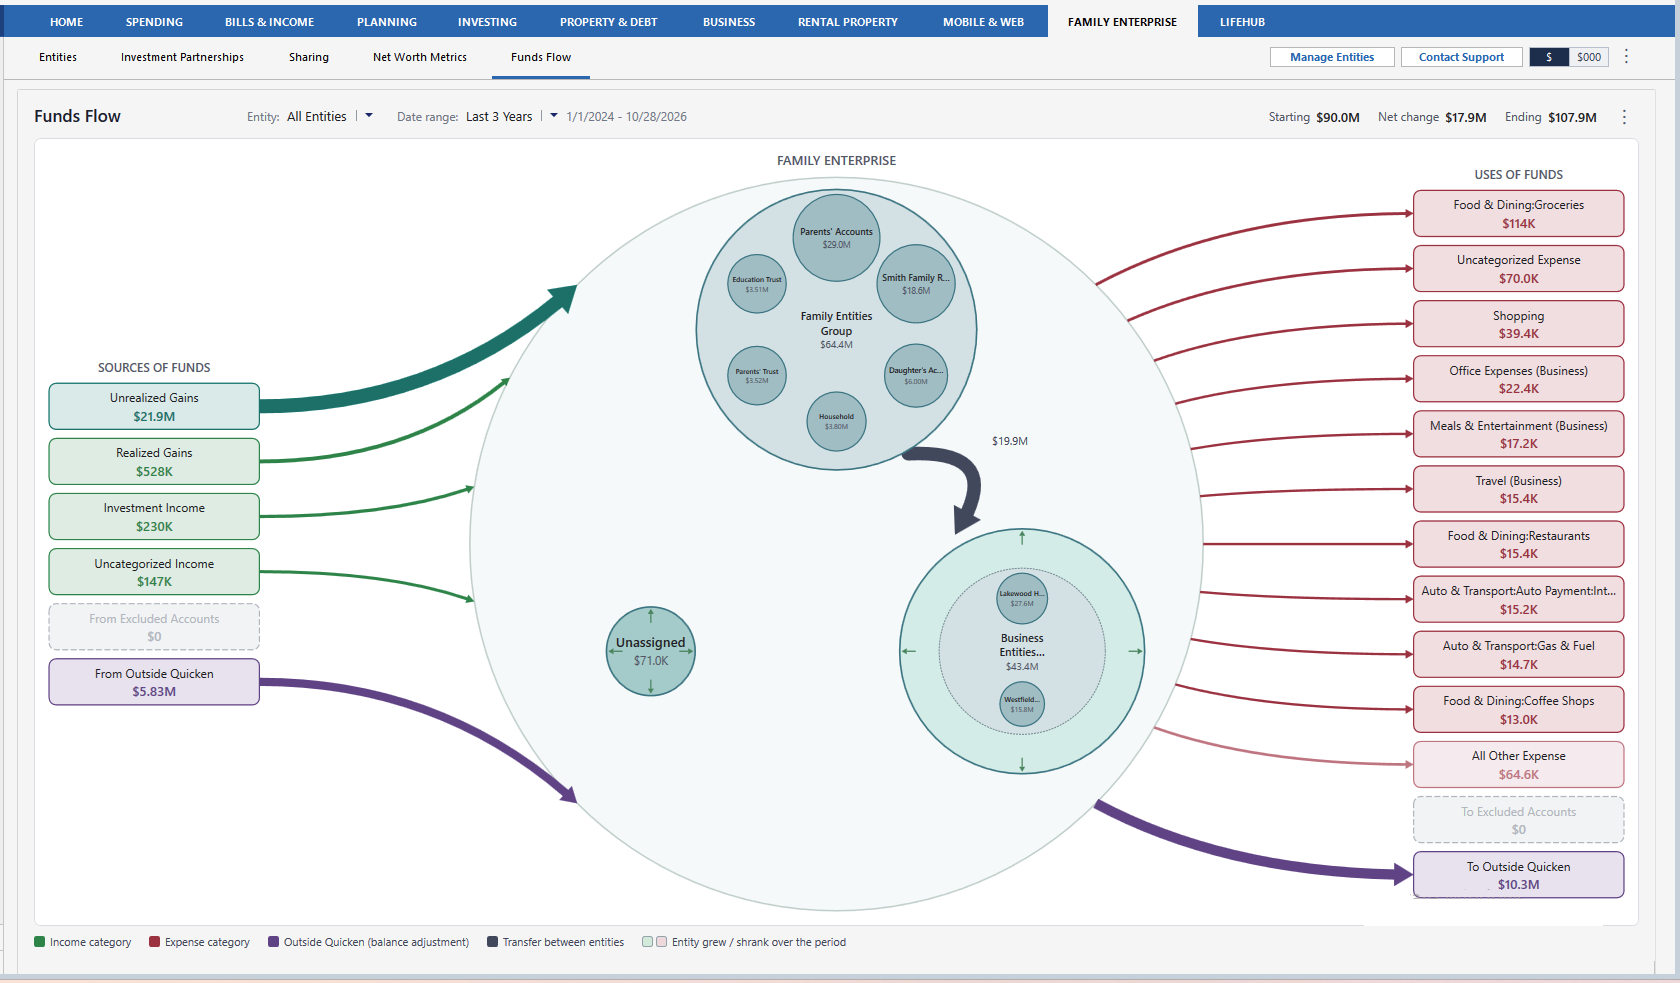
How to read the Funds Flow diagram
The Funds Flow diagram reads from left to right. Money enters from the sources on the left, passes through your entities in the center, and leaves through the uses on the right. The width of each arrow reflects the amount of money it represents.
Summary amounts
The header above the diagram shows three totals for the entities and date range you’re viewing:
-
Starting: The combined balance of your entities at the beginning of the date range.
-
Net change: The total of all money flowing in and out of your entities during the date range.
-
Ending: The starting balance plus the net change.
Sources of funds
The Sources of Funds column lists where money entered your entities during the date range. Sources include income categories, realized gains, unrealized gains, investment income, and money from outside Quicken. Each box shows the total for that source.
Entities and entity groups
The center of the diagram shows your entities and entity groups as bubbles. Each bubble displays its ending balance for the date range, and larger bubbles hold more money. When entity groups are shown, each group appears as a large bubble with its entities inside.
Accounts that aren’t assigned to an entity appear in the Unassigned bubble. Funds Flow treats Unassigned the same way it treats your other entities.
Each bubble also shows how its balance changed over the date range. A dotted inner circle marks the starting balance, and the solid outer circle marks the ending balance. Arrows that point outward between the two circles mean the balance grew, and arrows that point inward mean it shrank. When the gap between the circles is narrow, the arrows don’t appear, and you see only the two circles.
Dark arrows between bubbles show money transferred from one entity to another.
Uses of funds
The Uses of Funds column lists where money left your entities during the date range. Uses include expense categories and money that went outside Quicken. Categories beyond the number you choose to show are grouped into an All Other Expense box.
Money from and to outside Quicken
From Outside Quicken and To Outside Quicken capture balance changes that aren’t tied to a category, such as balance adjustments. For example, if you add a property you own outright, Quicken records its equity as a balance adjustment, and that amount appears under From Outside Quicken. If you lower a property’s value with a balance adjustment, or close an account and Quicken adjusts its balance to zero, that amount appears under To Outside Quicken.
Legend
The legend below the diagram identifies what each color represents:
-
Income category: Green boxes and arrows.
-
Expense category: Red boxes and arrows.
-
Outside Quicken (balance adjustment): Purple boxes and arrows.
-
Transfer between entities: Dark gray arrows.
-
Entity grew / shrank over the period: Bubble shading that shows whether an entity’s balance increased or decreased.
Choose what to view
Two selectors at the top of Funds Flow control what the diagram includes. Every amount and flow updates when you change either one.
-
Entity: Select All Entities to view your full financial picture, or select an entity or entity group to focus on it.
-
Date range: Select Year to Date, Last 12 Months, Last Year, Last 3 Years, Last 5 Years, Last 10 Years, Last 25 Years, or Custom. The exact dates appear next to the selector. The Last N Years options start on January 1 of the earliest year in the range. For example, if today is in 2026, Last 3 Years starts on January 1, 2024.
Explore the details
You can hover over any part of the diagram to see more information, or click a bubble to look inside it.
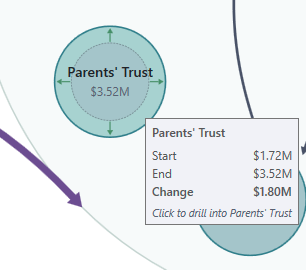
View details
Hover over a bubble, arrow, source, or use to see its full name and amounts. When you hover over an entity or entity group, Quicken shows its starting balance, ending balance, and change for the date range. Hovering also shows the full name of any label that’s cut off in the diagram.
Drill down into an entity
Click a bubble to see what’s inside it. Click an entity group to open it and see its entities, then click an entity to see its accounts. At the account level, click an account bubble to open a Transaction report that lists the transactions behind that amount.
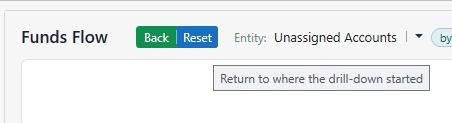
To move back up, use the buttons at the top of Funds Flow:
-
Back: Returns you one level up.
-
Reset: Returns you to where the drill-down started. This button appears when you’re more than one level deep.
Change display settings
Display settings control how much detail the diagram shows. To change them, click the ⋮ menu to the right of the summary amounts.
-
Entities/Accounts Shown: Choose Top 3 + All Other, Top 5 + All Other, Top 8 + All Other, or All. Entities beyond the number you choose are grouped into an All Other bubble.
-
Source/Use of Funds Shown: Choose Top 5, Top 8, or Top 10 to set how many of the largest sources and uses appear. Smaller categories are grouped into an All Other box.
-
Include Unrealized Gains: Adds an Unrealized Gains box to the sources column. Unrealized gains are increases in the value of investments you haven’t sold. This setting is on by default.
-
Show Amount Labels on Entity Flows: Shows dollar amounts on the arrows between entities. When this setting is off, the arrows show only direction and relative size.
-
Entity Flow Display: Choose Net Flow to show one arrow with the net amount that moved between two entities, or Both Directions to show a separate arrow for each direction.
-
Show Entity Groups: Groups entities inside their entity group bubbles. When this setting is off, each entity appears as its own bubble.
-
Show Related Entities on Drilldown: When you drill into an entity, shows which other entities exchanged money with it and the amounts involved. When this setting is off, the drill-down shows only the entity’s own accounts.
-
Privacy Mode: Hides all dollar amounts in Funds Flow. Turn this on before you share your screen or take a screenshot.