
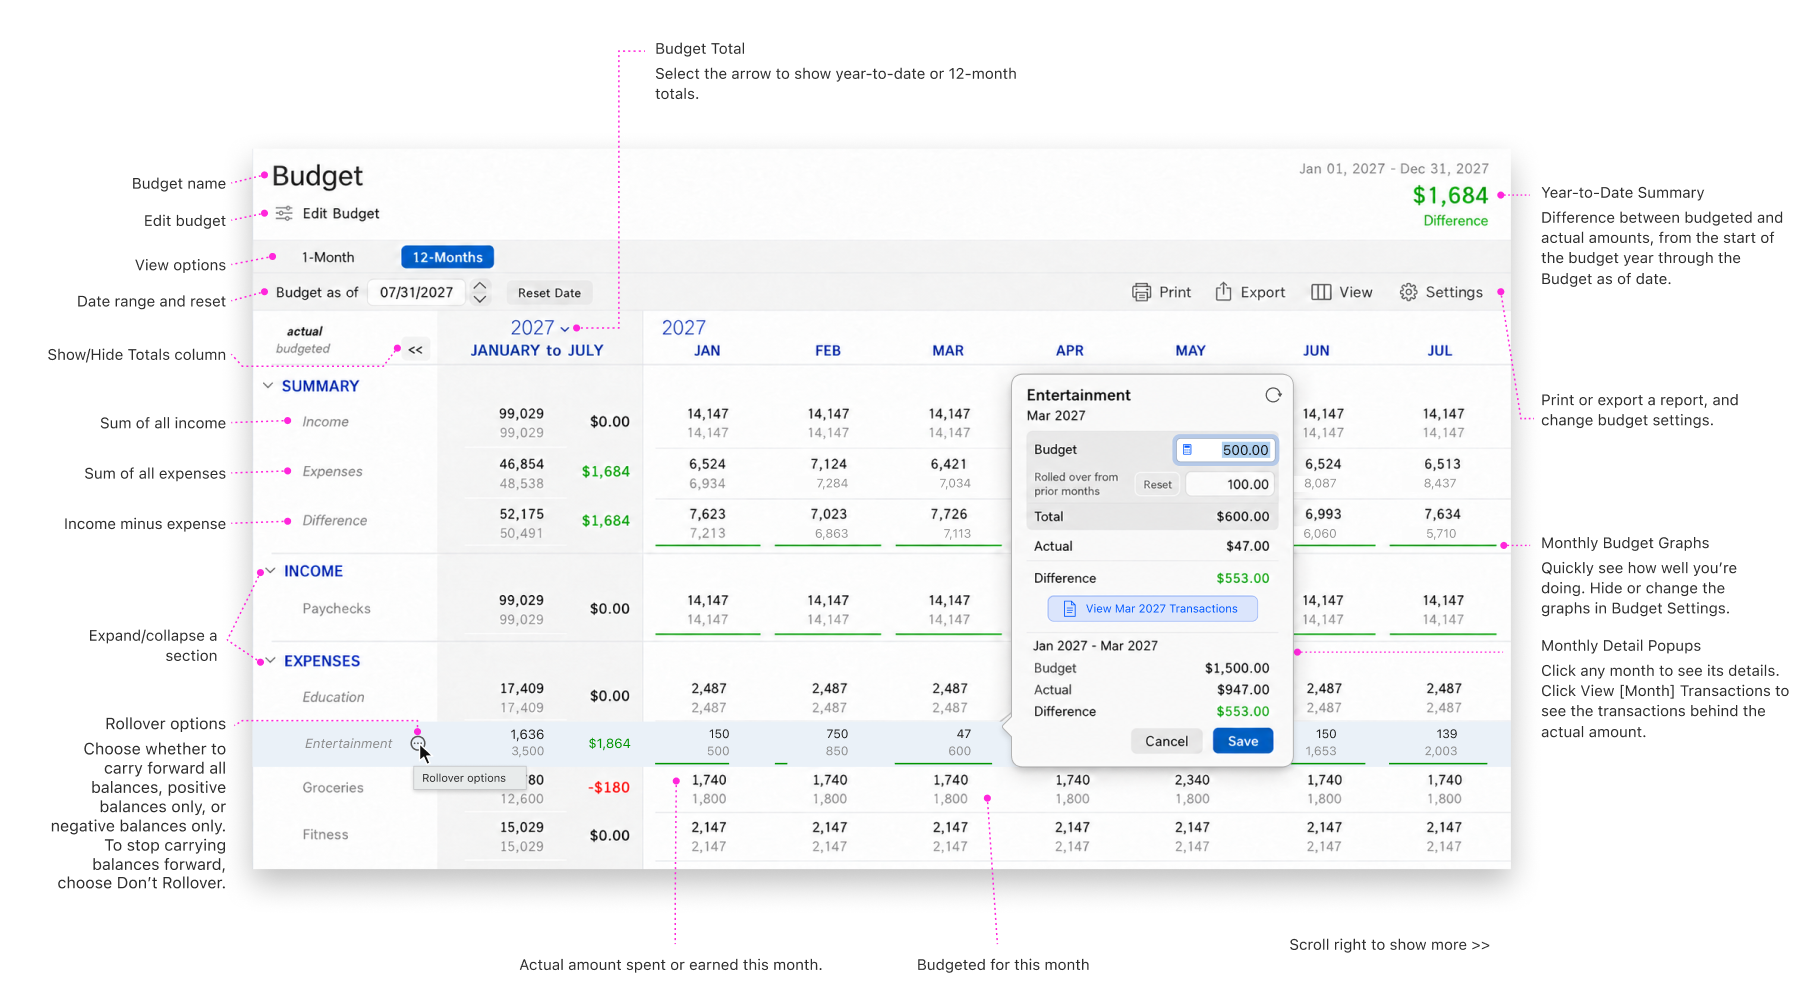
The Budget view compares your actual income and spending with the amounts you budgeted. To open it, click Budgets in the toolbar.
The upper-right corner of the view shows the date range you’re viewing and the total difference between your budgeted and actual amounts for that range. Use the 1-Month and 12-Months buttons to switch between the two layouts. To change budget amounts or categories, click Edit Budget. To create a report, click Budget Report.
How Quicken calculates the difference
The difference tells you whether a category is ahead of or behind its budget. Quicken calculates it so that a positive number is always a good result:
-
For income, the difference is the actual amount minus the budgeted amount. Earning more than you budgeted produces a positive difference.
-
For expenses, the difference is the budgeted amount minus the actual amount. Spending less than you budgeted produces a positive difference.
Positive differences appear in green and negative differences appear in red.
12-Months view
The 12-Months view shows your budget as a grid. It has a summary column on the left and a column for each month of the budget year. The current month’s heading appears in blue.
Read the grid
Each cell shows two amounts. The actual amount appears on top in bold, and the budgeted amount appears below it in gray. The legend in the upper-left corner of the grid identifies the two rows.
The grid is organized into three sections:
-
SUMMARY shows your total income, total expenses, and the difference between them.
-
INCOME lists your income categories.
-
EXPENSES lists your expense categories.
Parent categories show the combined totals of their subcategories. To show or hide a parent category’s subcategories, click the arrow next to its name.
Colored bars below some amounts show how the actual amount compares with the budget. A green bar indicates a favorable result, and a red bar indicates an unfavorable one.
Use the summary column
The summary column shows the actual amount, the budgeted amount, and the difference for each row. Its heading names the period it covers. To change the period, click the arrow next to the year at the top of the column, and then choose one of the following options:
-
Budget Year-to-Date Totals covers the start of the budget year through the current month.
-
Entire Budget Year Totals covers the full budget year, including the remaining months.
To hide the summary column and give the monthly columns more room, click <<. Click it again to show the column.
Change the period
The Budget as of box shows the month the view is based on. Click the arrows next to the box to move to an earlier or later month. To return to the default period, click Reset Date.
View details for an amount
You can open a details window for any amount in the grid. Click an amount to see details for that month, or click a row name to see totals for the period shown in the summary column.
The details window shows the following information:
-
The row name and the period the amounts cover.
-
The budgeted amount, the actual amount, and the difference.
-
For a single month, a second set of totals that runs from the start of the budget year through that month.
-
A button that opens the transactions behind the amounts, such as View Oct 2026 Transactions.
Change a budget amount
You can change the budgeted amount for a category and month directly from the grid.
-
Click the amount for the category and month you want to change.
-
In the details window, enter the new amount in the Budget box. You can also click the calculator button in the box to work out the amount.
-
Click Save. To close the window without changing the amount, click Cancel.
Note: Rows in the SUMMARY section are calculated from your categories, so you can’t edit them. To change budget amounts across several months or to manage rollovers, see Editing your budget.
Choose how much detail to show
The View menu controls how much category detail the grid displays. Click View, and then choose one of the following options:
-
Expand All shows every subcategory.
-
Collapse All collapses every category group.
-
Top-Level Items Only and Summary of all Items show only top-level categories.
Print or export your budget
You can print or export the 12-Months view. Click Print to print the grid, or click Export to save the data to a file you can open in a spreadsheet. For details, see Printing budgets.
Change the display settings
The Budgets settings control how amounts and bars appear in the grid. To open them, click Settings in the Budget view, or open Quicken settings and click Budgets.
-
Show cents displays amounts to the cent instead of rounding to whole dollars.
-
Layout controls how the actual and budgeted amounts share a cell. Stacked shows the actual amount above the budgeted amount.
-
Bar style controls how the progress bars are drawn.
-
Highlight controls what Quicken highlights when you select a cell. Row and column highlights both the row and the column of the selected cell.
1-Month view
The 1-Month view shows a single month, with a progress bar for each budgeted category. To move between months, use the arrows next to the month name. The left arrow shows the previous month, the center button returns to the current month, and the right arrow shows the next month.
The view has an Income section and an Expenses section. Each section starts with a total row, Budgeted Income or Budgeted Expenses, followed by each category in that section.
Each row includes the following information:
-
A bar that shows the actual amount, measured against the budgeted amount from 0% to 100%.
-
The Goal column, which shows the budgeted amount.
-
The Results column, which shows how far the category is over or under its goal, or how much remains.
Results that work against your budget appear in red, such as spending over your goal or earning less than you expected. In the current month, a TODAY marker shows how far into the month you are, so you can compare your progress with the calendar.
For more information