Business Reports
Business Reports are a vital component of the Business Dashboard in Quicken for Mac's Business & Personal (B&P) tier. These reports offer you a window into the financial performance of your business, providing valuable insights that enable you to make informed decisions. In this comprehensive guide, we'll delve into the world of Business Reports, helping you understand how to access, interpret, and leverage them effectively. Whether you're a seasoned financial expert or just starting out, this page is your dedicated resource for harnessing the power of Business Reports to gain a deeper understanding of your business's financial health.
From the Dashboard, you can access your business reports by selecting the one you want to run.
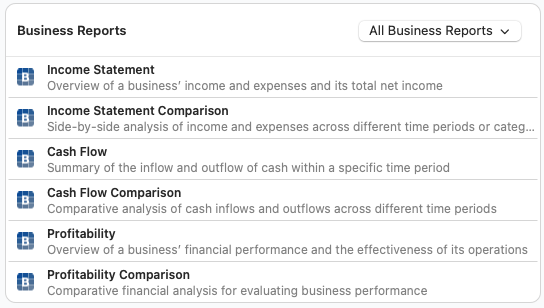
Here are the business reports you can run out of the box (You can always customize reports as well).
Customizing Reports
While reports work great out of the box, there are some things you may need to customize, such as the Date Range, Accounts, Categories, Businesses, Tags, and Payees. To customize your report, select the Edit button above the report.

For more information about customizing reports, see Create and Customize Reports.
Income Statement
Your Income Statement is like a financial storytelling tool, depicting your business's earnings and expenditures over a certain period. It's where you get to see the fruits of your labor itemized as income and the inevitable costs of running your show detailed as expenses. At the bottom line, it reveals your net income, giving you a clear measure of just how much you've financially grown after all is said and done. It's a personal reflection of your business's financial health and success.
The primary sections of your Income Statement are Revenue, Expenses, and Net Income. Within those sections, your report is further divided into categories. You can change the date ranges (and other details) by using the Edit button above the report.

Income Statement Comparison
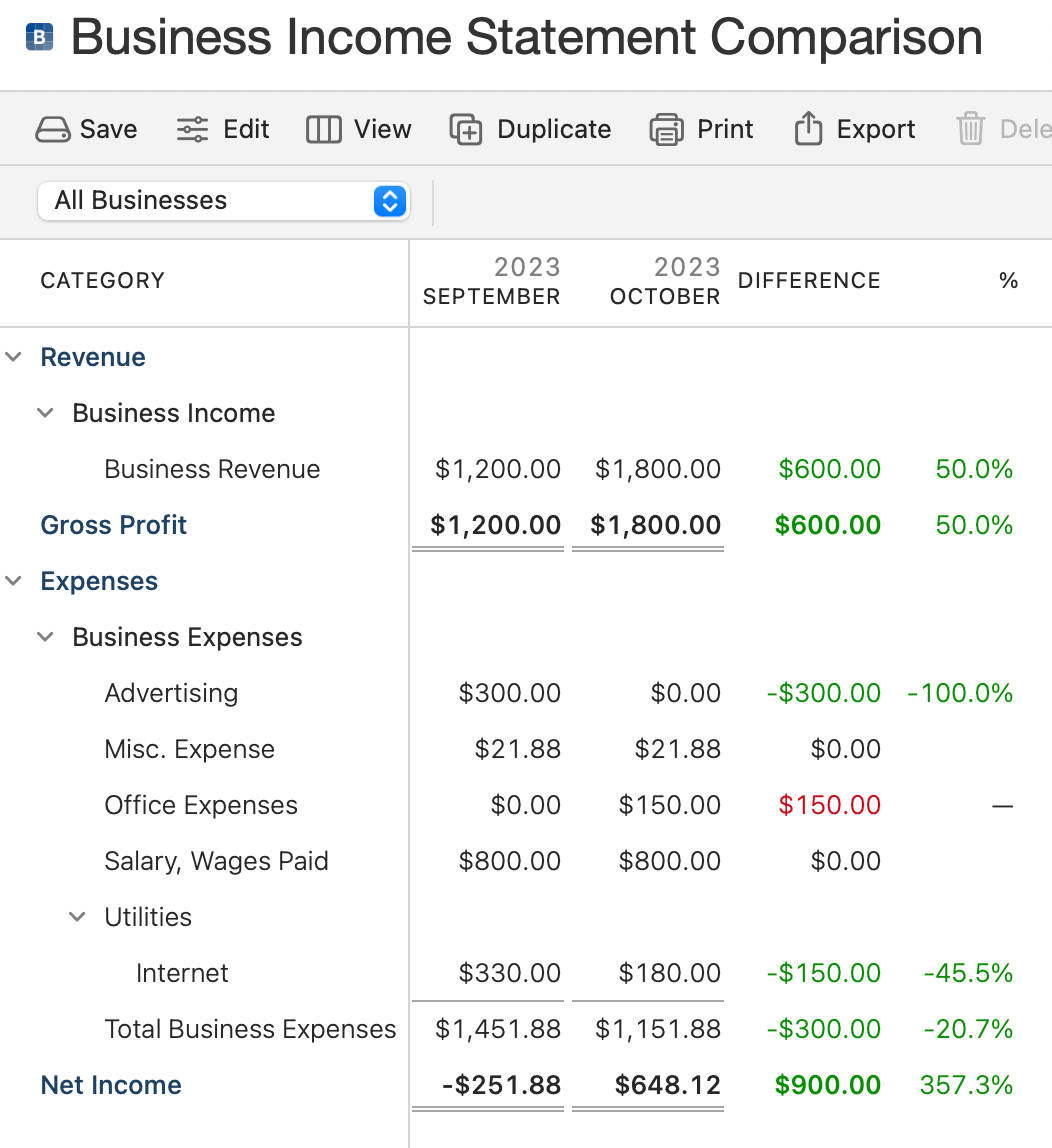
The Income Statement Comparison is a bit like having a financial time machine. It gives you a side-by-side look at your business's earnings and outgoings from one period to another or across different areas of your business. It's a powerful way to track your progress, pinpoint trends, and make informed decisions about where your business is headed. This tool helps you spot the changes, celebrate the wins, and strategize over the challenges, keeping your business journey on course.
The primary sections of your Income Statement are Revenue, Expenses, and Net Income. Within those sections, your report is further divided into categories. Unlike the Income Statement, you will also have columns for both time periods and a column showing the difference (green for positive, red for negative). You can change the date ranges (and other details) by using the Edit button above the report.
Cash Flow
Your Cash Flow statement is an overview of your business's cash movements during a specific period. It captures the ebb and flow of cash coming within your business. This is an overview report without the detail of the Income Statement.
The primary sections of your Cash Flow are Operating Activities, Net Income, Cash at Beginning of Period, and Cash at End of Period. You can change the date ranges (and other details) by using the Edit button above the report.

Cash Flow Comparison
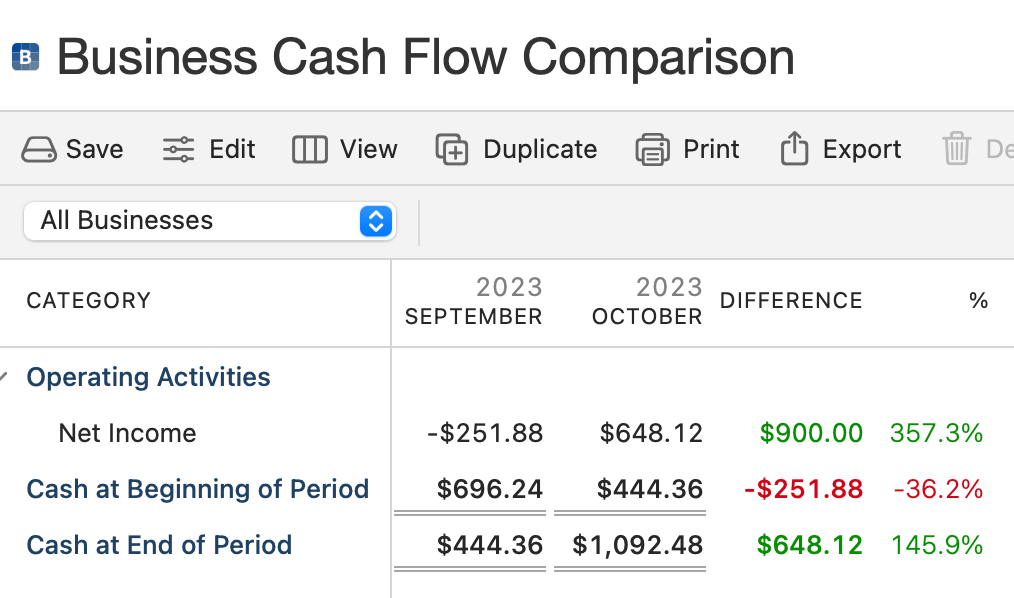
The Cash Flow Comparison offers you a window into how your business's cash situation has evolved by laying out a comparative analysis of money received cash on hand for different periods. It’s like having a conversation with your past and present financial decisions, seeing how they stack up against each other. This comparison helps you understand the rhythm of your business's financial cycles, and it's a practical way to spot trends, plan for the future, and ensure you're on solid ground for the road ahead.
The primary sections of your Cash Flow report are Operating Activities, Net Income, Cash at Beginning of Period, and Cash at End of Period. You will also have columns for both time periods and a column showing the difference (green for positive, red for negative). You can change the date ranges (and other details) by using the Edit button above the report.
Profitability
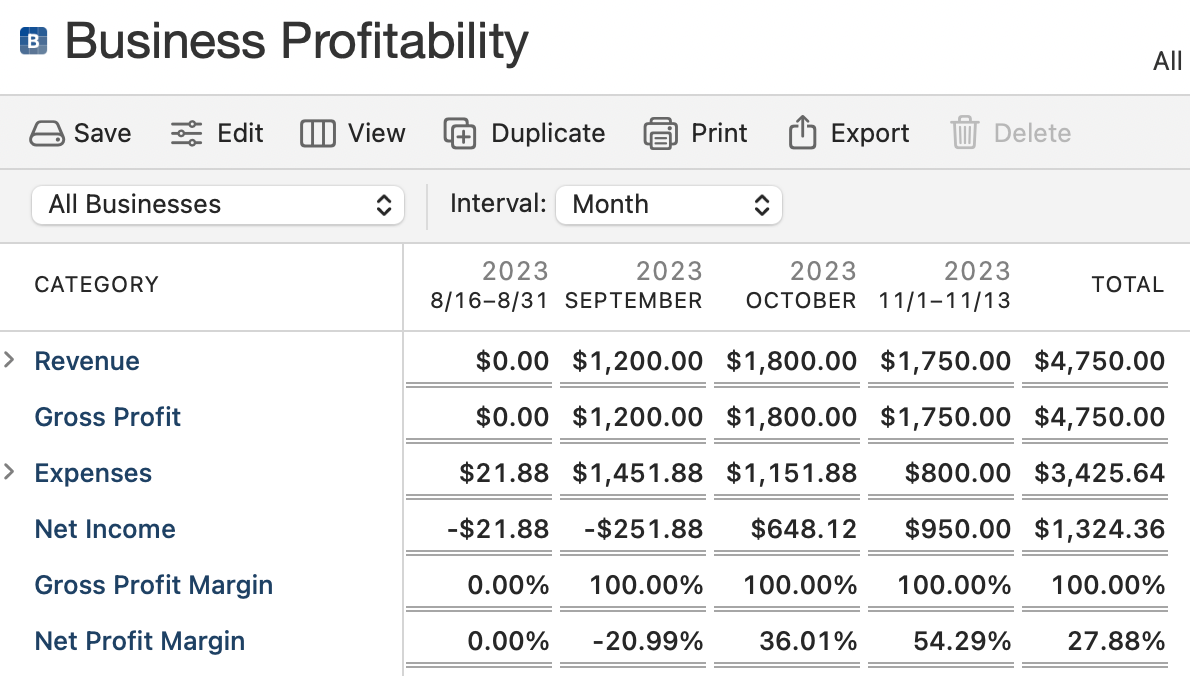
The Profitability report serves as a reflective overview of your business's financial performance, shedding light on just how effectively your operations are turning gears into profit. It's a distillation of your strategic decisions, market conditions, and operational efficiencies, all represented through the lens of financial gain.
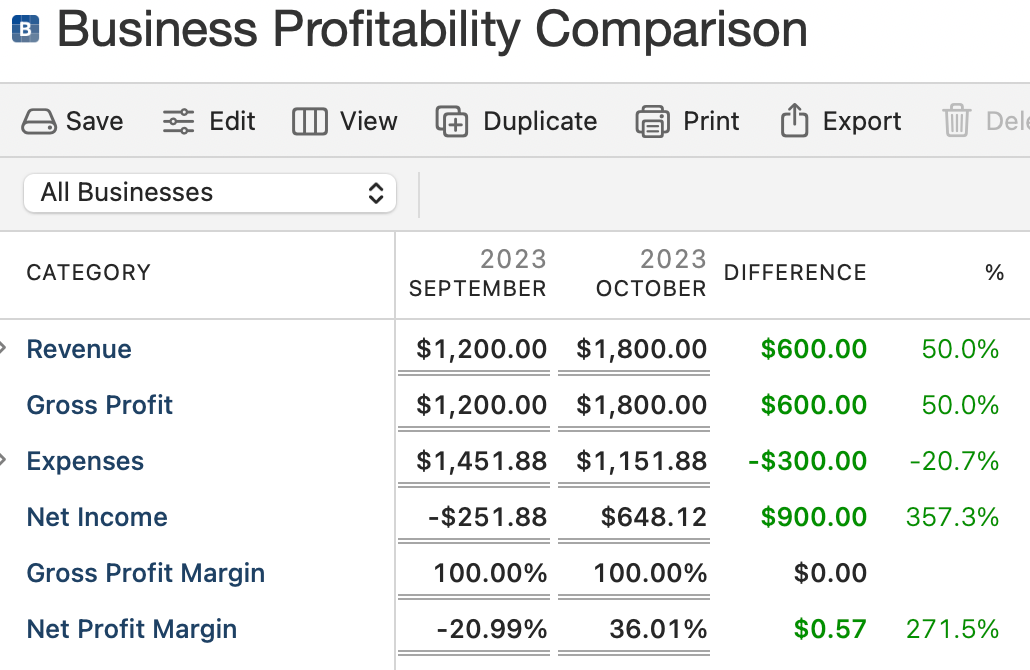
The primary sections of your Business Profitability report are Revenue, Gross Profit, Expenses, Net Income, Gross Profit Margin, and Net Profit Margin. You can break up a time period by Interval, such as Week or Month. You can also expand on the Revenue and Expenses sections to see details down to the Category level. You can change the date ranges (and other details) by using the Edit button above the report.
Profitability Comparison
The Profitability Comparison is your tool for engaging in a financial dialogue between different periods of your business's operation. It's a comparative financial analysis that puts your business performance under the microscope, contrasting your revenue and cost strategies over time. This comparative lens helps you discern patterns in profitability, guiding you to make informed decisions that could enhance your business's financial outcomes in the future.
The primary sections of your Business Profitability report are Revenue, Gross Profit, Expenses, Net Income, Gross Profit Margin, and Net Profit Margin. You can also expand on the Revenue and Expenses sections to see details down to the Category level. Two date ranges will be compared. You will have columns for both time periods and a column showing the difference (green for positive, red for negative). You can change the date ranges (and other details) by using the Edit button above the report.
