Investing portfolio tab
One of the primary advantages of creating a Quicken account for each of your real-world investment accounts is that you can see the overall effect of your investment decisions. The Quicken portfolio view lists every security in your Quicken investment accounts.
Note that Quicken relies on accurate and complete data to derive reliable performance measures. For this purpose, it may be necessary first to update the transactions that are highlighted to add cost basis.
Using the Portfolio toolbar

The Portfolio toolbar gives you control of your investment experiences. You can:
- Use Date as of to see what your holdings looked like on a particular date.
- Use the group selector to choose how you want to review your holdings. See Group By below for more information.

- Use the account selection to choose between All Investing Accounts and other options such as individual accounts or just retirement or brokerage accounts.
- Review the Updated date and time to see when your holdings were most recently updated in Quicken.
- Update your holdings using .
Viewing your Holdings
The Quicken portfolio provides a overview of investing performance using various standard views such as portfolio value, performance and realized gains.

Value over time chart
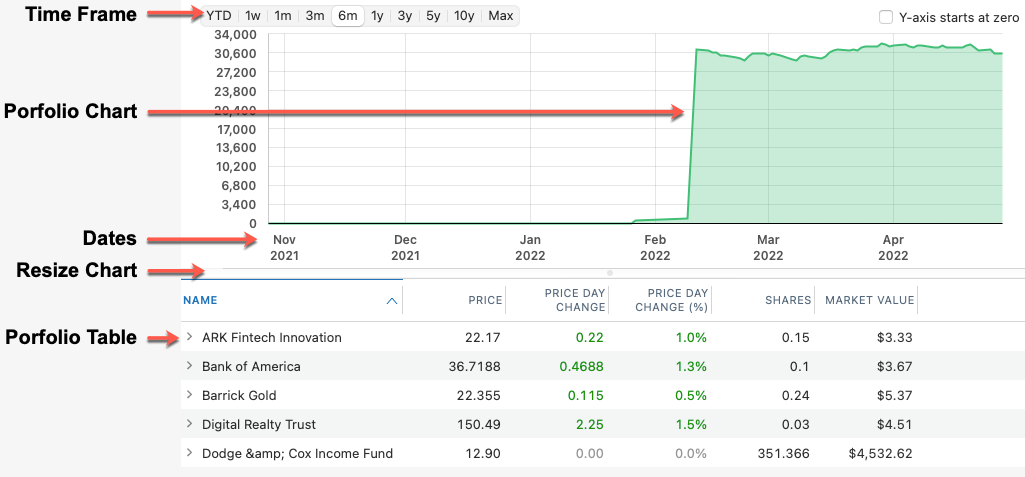
At the top of the portfolio view is a chart of the market value over time for the account or group of accounts.
- Time Period - See the market value over different periods of time:
- YTD - This shows the market value for the beginning of the year to the Price of Holdings date. By default this date is set to today.
- 1yr - This shows the market value over the course of the previous year from the Price of Holdings date. By default this date is set to today.
- 3yr - This shows the market value over the course of 3 years from the Price of Holdings date. By default this date is set to today.
- 5yr - This shows the market value for the past 5 years from the Price of Holdings date. By default this date is set to today.
- 10yr - This shows the market value for the past 10 years from the Price of Holdings date. By default this date is set to today.
- Max - This shows the market value for your current holdings since purchase.
- How do I hide the chart? - You can hide the chart by shrinking the chart area. Below the chart you should see a bar with a dimple in its center. Drag this bar to the top to hide the graph. If you want to see the chart again, drag down to expose the chart.
Chart Shortcuts
| Shortcut | Description |
|---|---|
Left / Primary Click | Lock/Unlock the value and date pop-up |
| Right / Secondary Click | Show/Hide the value and date pop-up |
| Center Click | Show/Hide crosshairs |
| Click and Drag | Focus on specific chart region |
Portfolio Views
From a drop-down menu on the left side just below the graph you can select from three different portfolio views:
- Portfolio Value - Useful for tracking and monitoring the market on a daily basis to see overall investment gains for your current holdings.
- Performance - Designed to provide you with insight into how well your investment strategy is performing, based on industry-standard metrics such as Internal Rate of Return (IRR) or Return on Investment (ROI). Use these values to help compare your performance against indices, ETFs, mutual funds, securities or asset managers.
- Realized Gain - Shows your sales that occurred in the previous year.
Group By
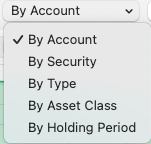
The securities in each portfolio view can be grouped in five different ways:
- Security - Groups the holdings by security.
- Type - Groups the holdings in the portfolio by the type of the security.
- Asset Class - Groups the holdings by asset class, such as large cap stock, small cap stock, international stock, etc.
- Holding Period - Groups the holdings by holding period, such as long term or short term.
- Account - Groups the securities by account. This only appears when an account group is selected in the sidebar (Investing, Brokerage, Retirement, or Education).
Accounts
If you're on an account group such as Investing, Brokerage, Retirement or Education then an Account drop-down menu also appears.
The account drop-down allows you to choose which accounts you would like to see in the combined view. This is generally important when you have accounts of different currencies.
Download Quotes
The download quotes button is a circular arrow. Click it to download the latest quotes.
There is also a preference for auto-downloading quotes. By default, the quote download will happen automatically when you launch Quicken and when you go to an investment account. If you don't want quotes to be downloaded automatically, turn this off in Quicken > Preferences.
Customize Columns
The Customize Columns button is the right-most button on the toolbar. Use it to tailor the portfolio view with the information you need to improve investment tracking and analysis. There are different sets of columns for each portfolio view that best match the focus of the view.

