How do I create a report or graph?
Quicken offers robust features to help you manage your financial data, such as creating and customizing reports and graphs that reflect your personal finances. Use this guide to navigate through the process smoothly.
Creating a Report or Graph
Access the Reports & Graphs Center by selecting the Reports menu → Reports & Graph Center. This serves as your hub for all reporting tools.
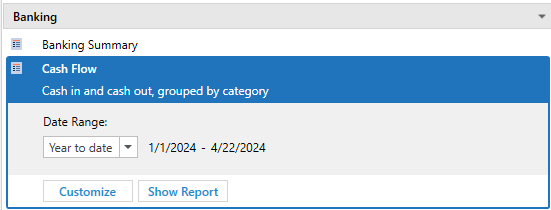
In the Quicken Standard Reports section, click the arrow next to the category that pertains to the information you need, such as Banking.
Choose the desired report or graph, such as Cash Flow, from the expanded list.
Set your date range. For comparison reports, you will need to set two date ranges.

Graphs
If a graph is available, there will be a button called Show Graph.
You can further customize the report by clicking Customize. This will bring up a window with options to customize the Display, Accounts, Categories, Payees, and other Advanced elements of the report.
Printing and Exporting
Print any report or graph by pressing Ctrl + P or clicking the Print icon.
Export data for further analysis to programs like Excel by using the Export function.
Managing columns
Customizing your Quicken reports is straightforward, allowing you to tailor the display to your preferences. Learn how to adjust column sizes, remove unnecessary columns, and choose which columns to display for a clear view of your financial data.
Changing column widths
In many reports, you can adjust your column widths to provide more or less space for certain columns. To do this:
Hover your cursor over the line between two columns until you see two arrows.

Drag the column in the direction you want to use to expand or reduce the width of the column.
Removing a column
If a column can be removed (many are required) from a report, you will see a small x if you hover over the column name.

Click the x to close the column.
Selecting the columns to include
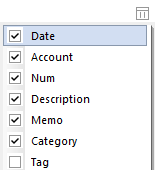
You may also find a column icon at the far right of the report. You can use that to select what columns to include or remove.

If this option is not available, all the columns are required.
Navigating the Report Menu Bar
The report menu bar in Quicken equips you with a variety of tools to enhance your report viewing and management experience. From historical navigation to exporting options, learn how each button facilitates a more efficient interaction with your financial reports.

Back: This button allows you to navigate back to the previous view or screen within the Quicken report history, similar to a browser's back function. This is only available if you've changed an aspect of the report (such as the Date range) after you opened the report.
History: This provides a drop-down list of recently viewed reports and screens, enabling quick navigation to a specific point in your session's history. This is only available if you've changed an aspect of the report (such as the Date range) after you opened the report.
Forward: After using the Back button, you can move forward in the history to the view or screen from which you came. This is only available if you've changed an aspect of the report (such as the Date range) after opening the report.
Delete: This allows you to remove the current view of the report within the report. This is only available if you've changed an aspect of the report (such as the Date range) after opening the report.
Email: This gives you the option to send the current report to yourself or others via email. You can send the report as either a PDF or an Excel Workbook.
Display: This allows you to change font size and row spacing for this report, as well as set alternating colors for some reports. You can also access Additional Settings for all reports.
Print: Initiates the printing process for the current report, allowing you to create a hard copy.
Export: This function lets you export the current report data to another format or application. You have the following options: Excel Workbook, Text, PDF, or Copy to Clipboard.
Save: This enables you to save the current state of the report for future reference.
Find/Replace: A tool to search for specific information.
Customize: Opens the customization options for the current report where you can alter settings.
Help: Provides access to Quicken's help resources for assistance with reports.
More about date ranges
The date controls which transactions Quicken uses while creating the report or graph.
Default date ranges
Option | Dates used |
|---|---|
Include all dates | Starting from your earliest Quicken transaction in the accounts selected for the report, and ending with your latest transaction in the accounts selected for the report. (If the selected accounts include future transactions, such as scheduled transactions, the future transactions will appear in the report. Otherwise, the ending date for the report is today's date.) |
Monthly | Starting from the first day of a specified month, quarter, or year, and ending on the last day of a specified month, quarter, or year. After you make a selection, Quicken displays another field so you can specify the month, quarter, or year that you want. (Quarters begin January 1, April 1, July 1, and October 1.) |
Month to date | Starting from the first day of this month, quarter, or year, and ending today. (Quarters begin January 1, April 1, July 1, and October 1.) |
Earliest to date | Starting from the earliest Quicken transaction in the accounts selected for the report, and ending with today's date. |
Custom to date | Starting from the specified date, and ending with today's date. When you select this option, Quicken displays a dialog where you can enter the date you want to start with. |
Current week | Starting from the first day of this week, month, quarter, or year, and ending with the last day of this week, month, quarter, or year. (Quarters begin January 1, April 1, July 1, and October 1.) |
Last week | Starting from the first day of last week, month, quarter, or year, and ending with the last day of last week, month, quarter, or year. (Quarters begin January 1, April 1, July 1, and October 1.) |
Last 30 days | Starting from 30 days ago, and ending with today's date. |
Last 12 months | Starting from 365 days ago, and ending with today's date. |
Prior year period (comparison reports only) | A range that matches the range from the line above, just one year earlier. |
Note for our Canadian Customers
The following terms will be different in the Canadian releases of Quicken.
Canada: "Cheque" / United States: "Check"
Canada: "Colour" / United States: "Color"
Canada: "Centre" / United States: "Center"
Canada: "Realise" / United States: "Realize"
Canada: "Behaviour" / United States: "Behavior"
Canada: "Analyse" / United States: "Analyze"
