
EasyAnswer reports and graphs are essentially customized versions of standard reports and graphs already set up to answer your questions. For some reports and graphs, you can get additional information, such as information about categories.
-
At the top of your Quicken screen, select Reports menu > Reports & Graphs Center.
-
In the Quicken Standard Reports list on the left, in the EasyAnswer reports and graphs area, select the question you want to be answered.
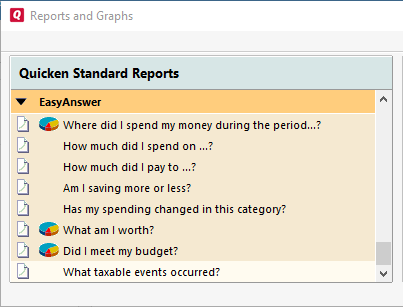
The following questions are answered by the following reports and graphs.
EasyAnswer question
Report Type
Graph
Where did I spend my money during the period...?
Income and expense
Income and expense
How much did I spend on...?
Itemized categories
How much did I pay to...?
Payee
Am I saving more or less?
Cash flow comparison
Has my spending changed in this category?
Cash flow comparison
What am I worth?
Net worth
Net worth
Did I meet my budget?
Budget
Budget
What taxable events occurred?
Tax summary
How are my investments performing?
Investment performance
Investment performance
What are my investments worth?
Portfolio Value
Portfolio Value
-
Select the default date range or choose the date range you want the report or graph to include. The date controls which transactions Quicken uses while creating the report or graph.
Date rangesOptionDates usedInclude all datesStarting from your earliest Quicken transaction in the accounts selected for the report and ending with your latest transaction in the accounts selected for the report. (If the selected accounts include future transactions, such as scheduled transactions, the future transactions will appear in the report. Otherwise, the ending date for the report is today's date.)Monthly, Quarterly, YearlyStarting from the first day of a specified month, quarter, or year, and ending on the last day of a specified month, quarter, or year. After you make a selection, Quicken displays another field so you can specify the month, quarter, or year that you want. (Quarters begin January 1, April 1, July 1, and October 1.)Month to date; Quarter to date; Year to dateStarting from the first day of this month, quarter, or year, and ending today. (Quarters begin January 1, April 1, July 1, and October 1.)Earliest to dateStarting from the earliest Quicken transaction in the accounts selected for the report, and ending with today's date.Custom to dateStarting from the specified date, and ending with today's date. When you select this option, Quicken displays a dialog where you can enter the date you want to start with.Current week; Current month; Current quarter; Current yearStarting from the first day of this week, month, quarter, or year, and ending with the last day of this week, month, quarter, or year. (Quarters begin January 1, April 1, July 1, and October 1.)Last week; Last month; Last quarter; Last yearStarting from the first day of last week, month, quarter, or year, and ending with the last day of last week, month, quarter, or year. (Quarters begin January 1, April 1, July 1, and October 1.)Last 30 daysStarting from 30 days ago, and ending with today's date.Last 12 monthsStarting from 365 days ago, and ending with today's date.Prior year period (comparison reports only)A range that matches the range from the line above, just one year earlier. -
If Quicken requests additional information, enter it.
Some questions require you to select a category or payee or security. Your choices determine which transactions Quicken includes in the report or graph. -
Click Show Report or Show Graph.
If there is no Show Graph button, the question you chose doesn't have a graph associated with it.
The following terms will be different in the Canadian releases of Quicken.
Canada: "Cheque" / United States: "Check"
Canada: "Colour" / United States: "Color"
Canada: "Centre" / United States: "Center"
Canada: "Realise" / United States: "Realize"
Canada: "Behaviour" / United States: "Behavior"
Canada: "Analyse" / United States: "Analyze"